Showing posts with label Excel Charts. Show all posts

Conditional Formatting bar chart

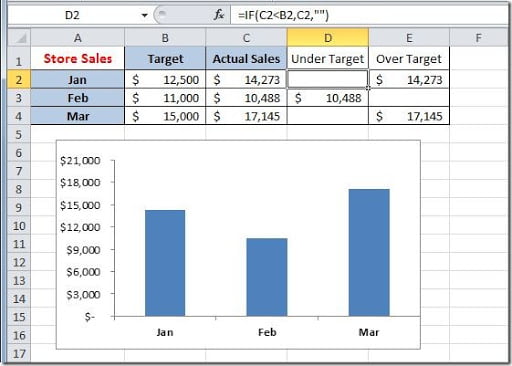
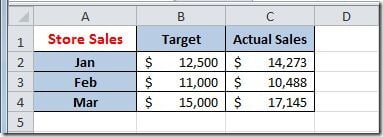
I’ve a table of data with target values and actual values, by month, like this:

Conditional_Formatting_Chart1

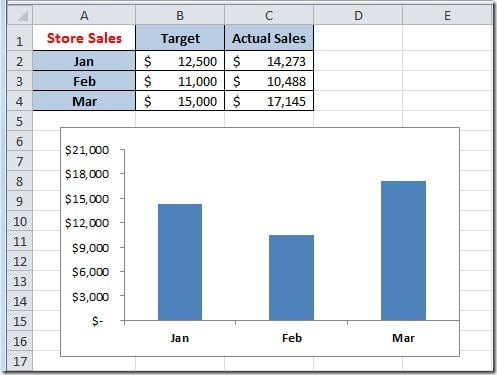
I want to create a bar chart with this data, something like this:

Conditional_Formatting_Chart2

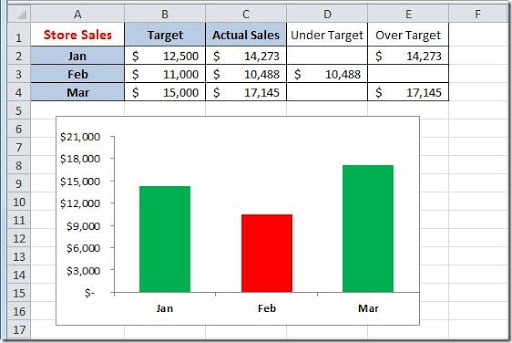
But I would like, for better understand the data, to see if the actual values, for each month, are above or below the target value. If it’s on target, or over the target, I would like the month bar to show up in green color and, if it’s below target, to show up in red color. This can be done by adding two columns to our table, one for the results “under target” and one for the results “over target”. On this two columns, what we are doing, is to check if the actual sales value is less that the target, then show the actual value; if not, leave the cell blank. This for the “under target” column. For the “over target” column, we are going to check if the actual sales value is equal, or greater than the target value. If true, then, show the actual sales value; if not, leave the cell blank. The result will be like this:

Conditional_Formatting_Chart3

For the “under target” column, put this formula on cell D2 and copy down:

=IF(C2<B2,C2,””)

For the “over target” column, put this formula on cell D2 and copy down:

=IF(C2>=B2,C2,"")

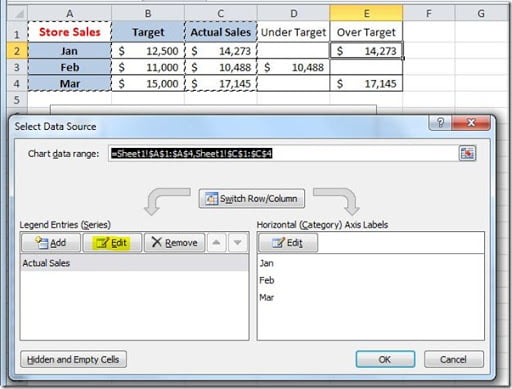
Now we need to change our chart data source. If you right click on your chart and select “Select Data”, it will open the “Select Data Source” dialog box, like this:

Conditional_Formatting_Chart4

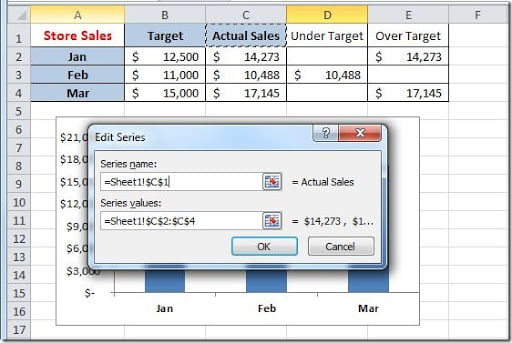
As you can see, your chart has only one data series. We are going to work with two data series: one for the “under target” values and one for the “over target” values. To start, we are going to change the series values for the existing series. For that, click on the Edit button on the Series box, on the left of the dialog box. This is pointing to column C, as you can see on the image below. We need to change the “Series name” to “=Sheet1!$D$1” and the “Series values” to “=Sheet1!$D$2:D$4” and click the OK button.

Conditional_Formatting_Chart5

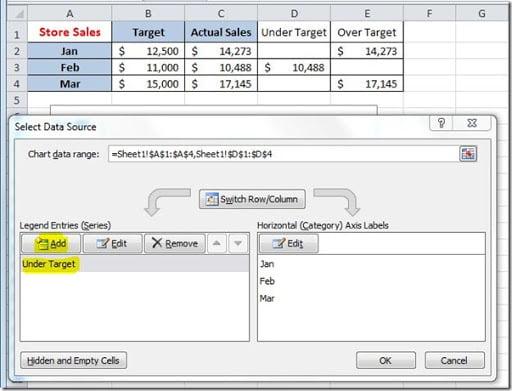
Our chart series in now point it out to the “under target” column. We need to add the second series for the “over target” values. Click on the Add button, on the Series box:

Conditional_Formatting_Chart6

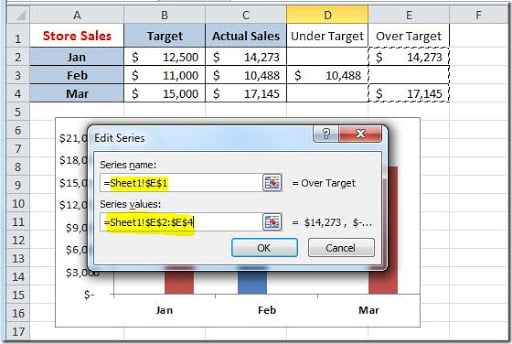
Fill out the “Edit Series” dialog box, like this, and click on the OK button:

Conditional_Formatting_Chart7

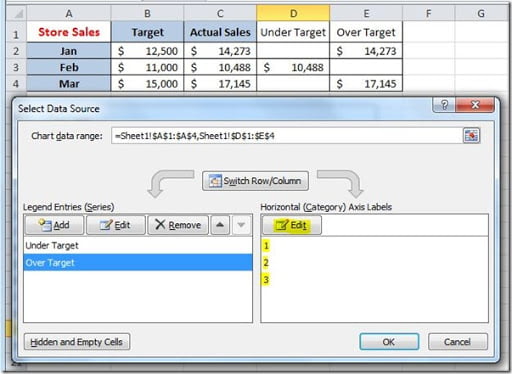
As you can see, you need to specify the “Horizontal Axis Labels” for this new series because it’s not showing up the months names. Just click on the Edit button and select the “=Sheet1!$A$2:$A$4” range.

Conditional_Formatting_Chart8

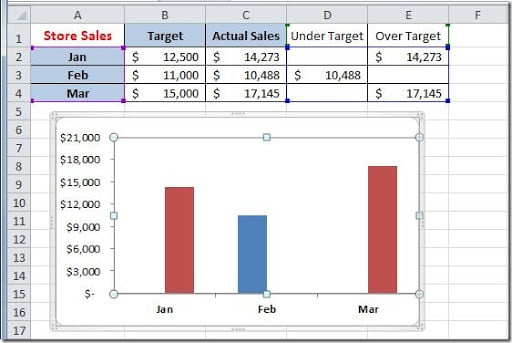
Close the “Select Data Source” dialog button, by clicking the OK button, and your chart should now look like this:

Conditional_Formatting_Chart9

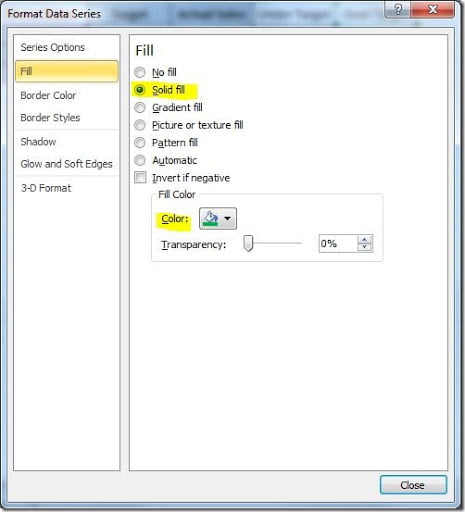
We need to change the color of our series bars to display the “under target” values as red bars and the “over target” values as green bars. Just right click on the “over target” bars and select “Format Data Series”. Go to the Fill group and select “Solid fill” with a green Fill Color. Click the Close button when finished.

Conditional_Formatting_Chart10

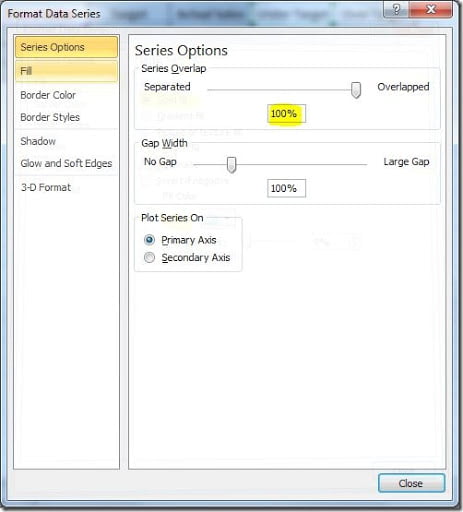
Do the same for the “under target” series but for this select a red Fill Color. Before clicking on the Close button, select the “Series Options” group and on the “Series Overlap”, put 100% so that the chart bars appear center between each month.

Conditional_Formatting_Chart11

When you click the Close button, the result should be like this:

Conditional_Formatting_Chart12

Try changing any value on the B2:C4 range to see the conditional formatting of the chart adjust the colors.
Add new data to an existing chart

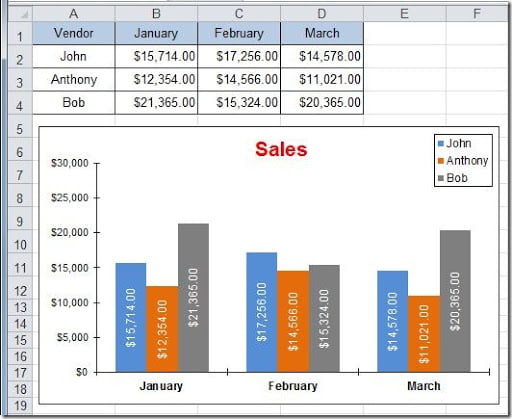
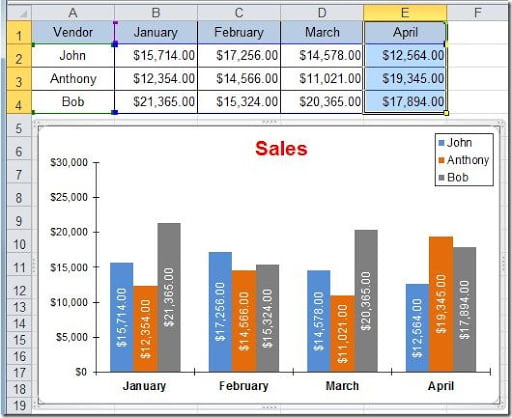
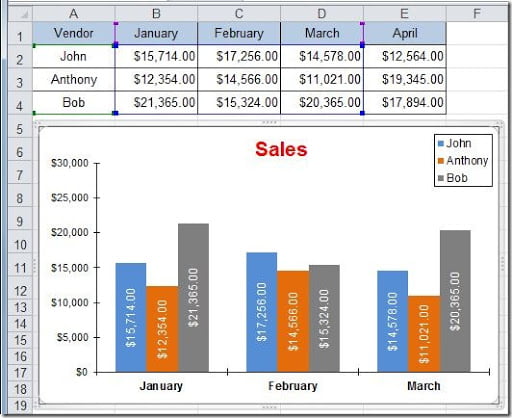
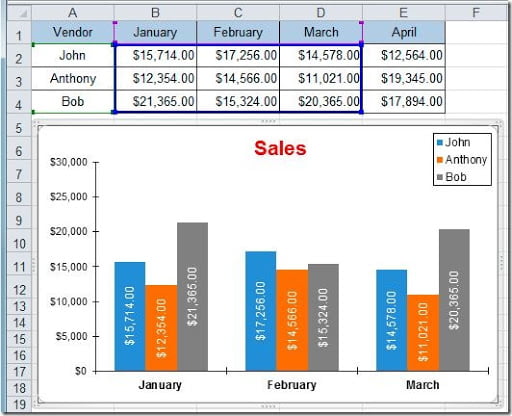
This is a common task on Excel. We have a chart and we need to update the data displayed by adding more data. For instance, we have a chart that displays data from January to March and we need to add data for a new month. Let’s see how we can do this. We have this existing chart:

Add_new_data_chart1

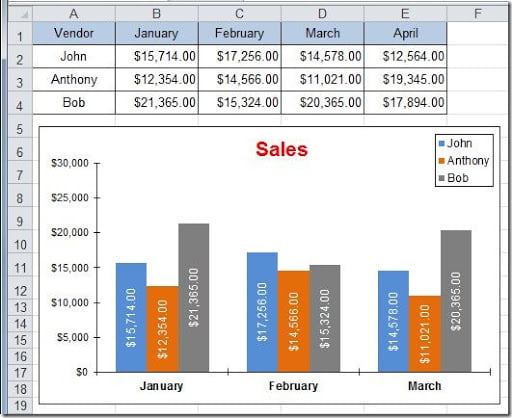
Now lets add a new column to our table to add the April sales data, like this:

Add_new_data_chart2

There are several ways of adding and additional column of data to our chart. Let’s see some:

Method 1: This is the easiest way of doing this but it’s now always possible to to. Instead of putting the new data on the right side of the last column, insert a new column between columns C and D, copy the March data into this new column and put the April values on column E. Because you are adding a new column inside the source data range of the chart, Excel will adjust to accommodate this new column. As I said, this is not always possible if you have more data below this table. If you insert a new column, it will mess the data below.

Method 2: Put the April data on column E. Select cells E1:E4 and press Ctrl+C (Copy). Then click on the chart to select it and press Ctrl+V (Paste). You will have your new data displayed on the chart, like this:

Add_new_data_chart3

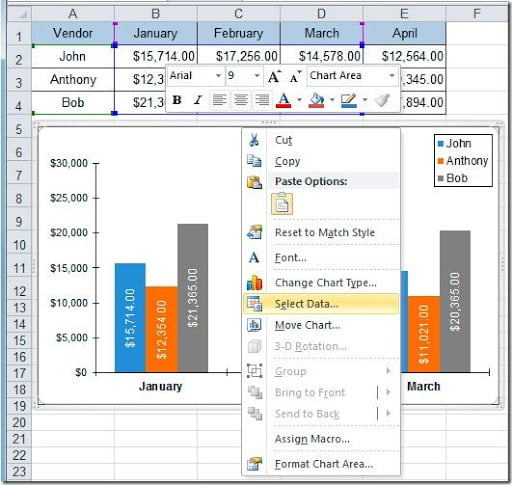
Method 3: This is the usually method that most people use. Right click on the chart and select the Select Data option, of go to the Design tab and on the Data group, click on the Select Data button.

Add_new_data_chart4

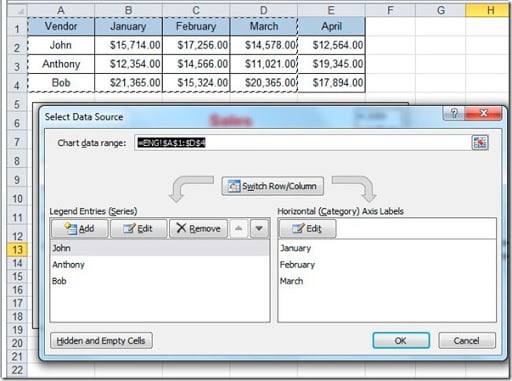
A Select Data Source dialog box opens and the chart source range get’s highlighted with the “marching ants”.

Add_new_data_chart5

With the cursor on the “Chart data range” field, just select the new data range, in this case select A1:E4. Click the OK button and your chart will be updated with the new data.

Method 4: Click on the chart. If you look at your table now, you can see blue, green and violet lines around the cells.

Add_new_data_chart6

If you pass the mouse on top of the blue line, it will get thicker showing you the actual source data of your chart, like this:

Add_new_data_chart7

Just drag the line, pushing from one of the blue squares on the corners, so that you get the new range of data selected, in this case range B2:E4 and release the mouse button so that your chart gets updated.

As you can see, there are many ways of doing the same thing in Excel. You just need to choose the one that you like it more.

Quick Excel Charts

This is a simple trick. If you have a series of data on your Excel sheet and want to make a quick chart with it, the fastest way is to select your range of cells that have the data and just press F11. This will create a new Chart sheet on your workbook. All you have to do next is to change the type of chart that is displayed and format it to suit your needs.

Excel Charts — Use an Image as Line Chart Markers

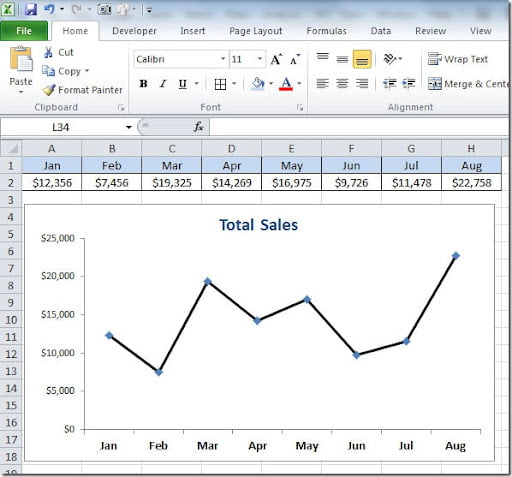
Excel line charts can have some different line markers but you can also use images to personalize your charts and give them a different look. When you create a line chart, it will look something like this simple example:
 
Chart_Markers_Images1
 
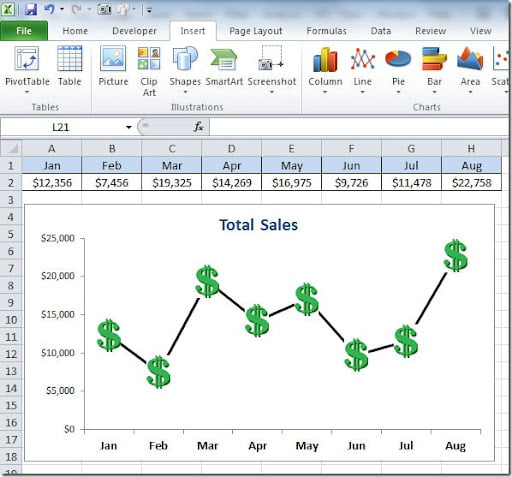
Here we have some diamond type line markers but we want to change this for a dollar sign marker. To do this we start by adding an image to our worksheet by going to Insert tab on our menu, then on the Illustrations group we can choose to add a Shape, Clipart or a Picture. Then format the image to a size that is suitable to the chart where you want to place it. Select the image and press Ctrl+C (Copy). On your chart, click on the line series to activate it. The line markers on your chart will be selected. Press Ctrl+V (Paste) to copy the image to your line markers and that’s it. Your chart will look something like this:
 
Chart_Markers_Images2
 
You can also have different images for each line marker. For instance, I could put green dollar signs on the months where the sales values increased and red dollar signs where the sales values decreased. When you Paste your image to your line markers, you can choose only the ones that you want to change the images instead of all the line markers.

Delete all pictures or charts on Worksheet

This is a tip on how you can delete all pictures and/or charts on a worksheet without having to manually select each one and delete them.
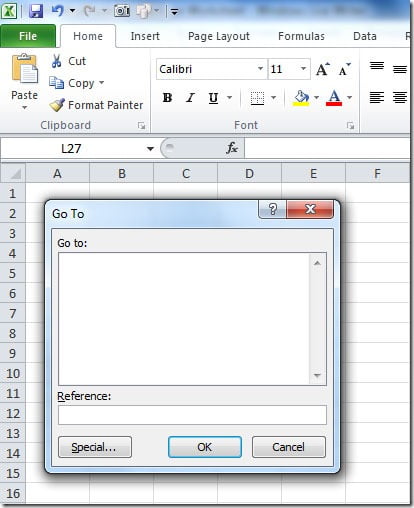
So, you can use the F5 shortcut key on Excel to open the Go To dialog box.

GoTo1
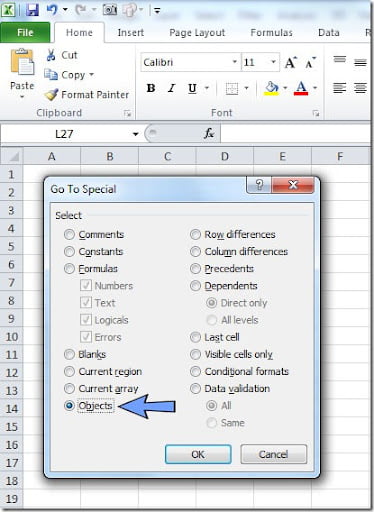
Then click on the Special button on the bottom of the dialog box to open the Go To Special dialog box.

GoTo2

Select the Objects option and click the OK button to close the dialog box. Now you have all of the objects on your worksheet selected. Check if you don’t have any more objects on your sheet that you don’t want to delete, like a company logo or something, before you press Delete key to delete all of them at the same time.

Create a Self-Expanding Chart

This happens very often with most of the Excel users. You have a set of data that you use to create a chart. If you latter want to add more data to the chart, you need to redefine your chart data series, unless if you didn’t add rows or columns in the middle of your original data where in this case, Excel will assume them on your chart.
To avoid this, just create your chart as usual. Then select any cell inside the range of data that you used to create the chart. Go to Insert-Tables to convert the range of data to a table. This is all you need to do for Excel to recognize the data as a table and the data added to the table can be reflected on the chart without the need to redefine your source.

Excel Charts - Hide Zeros

If you have a series of data to display on an Excel Chart, like this one:

It will look something like this:

As you can see, the chart will display the zero values. If you want to hide the zeros, you have two ways of doing:

Method 1:
1) Select the range of cells where you have the values for your chart
2) Right click and select Format Cells
3) On the Number tab, on Category, select Custom
4) In the "Type" box you will see the current format for the range you selected
5) Put the cursor on the end of the content of the Type box and enter 0,0;;; it it will look something like this picture:

6) Your zero values will be hiden now

Method 2:
Go to Tools, Options and on the View tab, under Window option, uncheck the Zero values options, like this:

Excel Charts - Add totals labels to Stacked Column chart

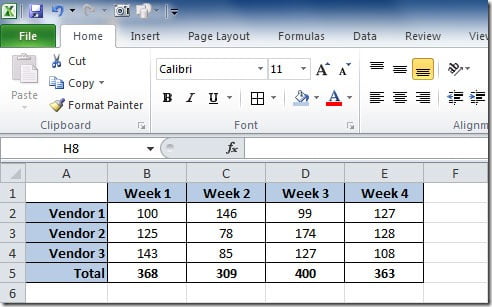
Let's say that I have the following table of data: 

ExcelCharts_Add_Totals1 
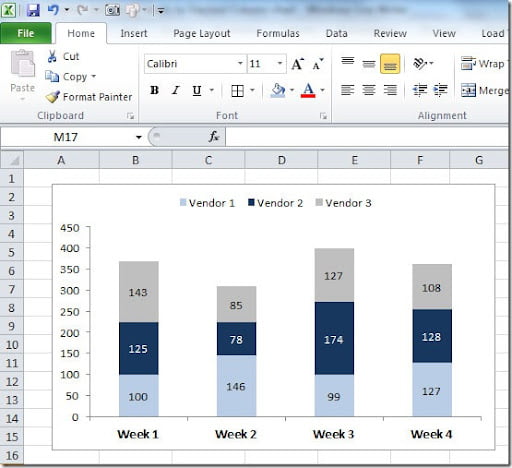
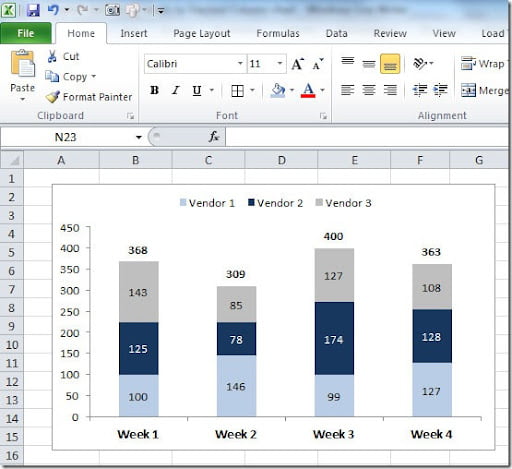
I can make a Stacked Column chart with 3 series, one for each Vendor. The chart will look like this: 

ExcelCharts_Add_Totals2
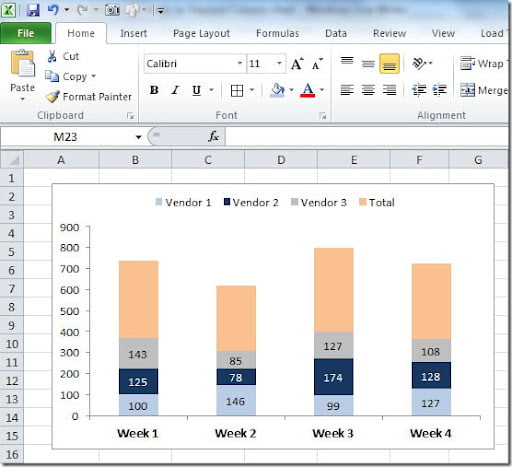
But I want to display on the top of each bar, the total for the Week (the sum of each Vendor). To do that, I need to add a 4th series to the chart. For that I select the chart and right-click on top of it and select Source Data. On the Series tab, on the Series, click on the Add button to add a new series. For the Values range, select the cells where the values of Total are on our table. For the Name, select the cell where we have "Total". Click OK and you will get a chart like this:
 
ExcelCharts_Add_Totals3 
Select this new series on the chart, right click and choose Format Data Series. On the Data Labels tab, Label Contains mark Value. Then on the Patterns tab put Border-None and Area-None. Click OK. Now select the labels, right click on them, choose Format Data Labels and on the Alignment tab, Label Position choose Inside Base. Click OK. You need to adjust the scale of your chart so that it looks like the original one. In this case, I changed Maximum value to 450 instead of Automatic. As you can see, the “Total” series name still shows up on the Legend. You need to select the Total legend and delete. The final result will be this something like this:

ExcelCharts_Add_Totals4 
Hope this helps you create better charts in Excel!

Excel Charts — Do not show empty dates

When we create a new chart in Excel, if the X axis labels are dates, Excel will assume “Automatic” on the Primary axis Category. Please check image below.

altOn this example I have dates 1, 2, 5, 6 and 7 of October. Only this dates have data on it.
 
altWith the option Category X axis set to Automatic, Excel will produce a chart like Chart 1:

alt

As you can see, Excel has added the dates that where missing between 2 and 5 of October. This dates are not a part of our original table and don’t have value to be charted so I don’t want to display them. This happens because Excel assumes that this is a Time-scale category chart. To remove this dates, go to Chart Options and set the Primary Axis-Category X axis to “Category”. This way we get a chart like Chart 2:

alt